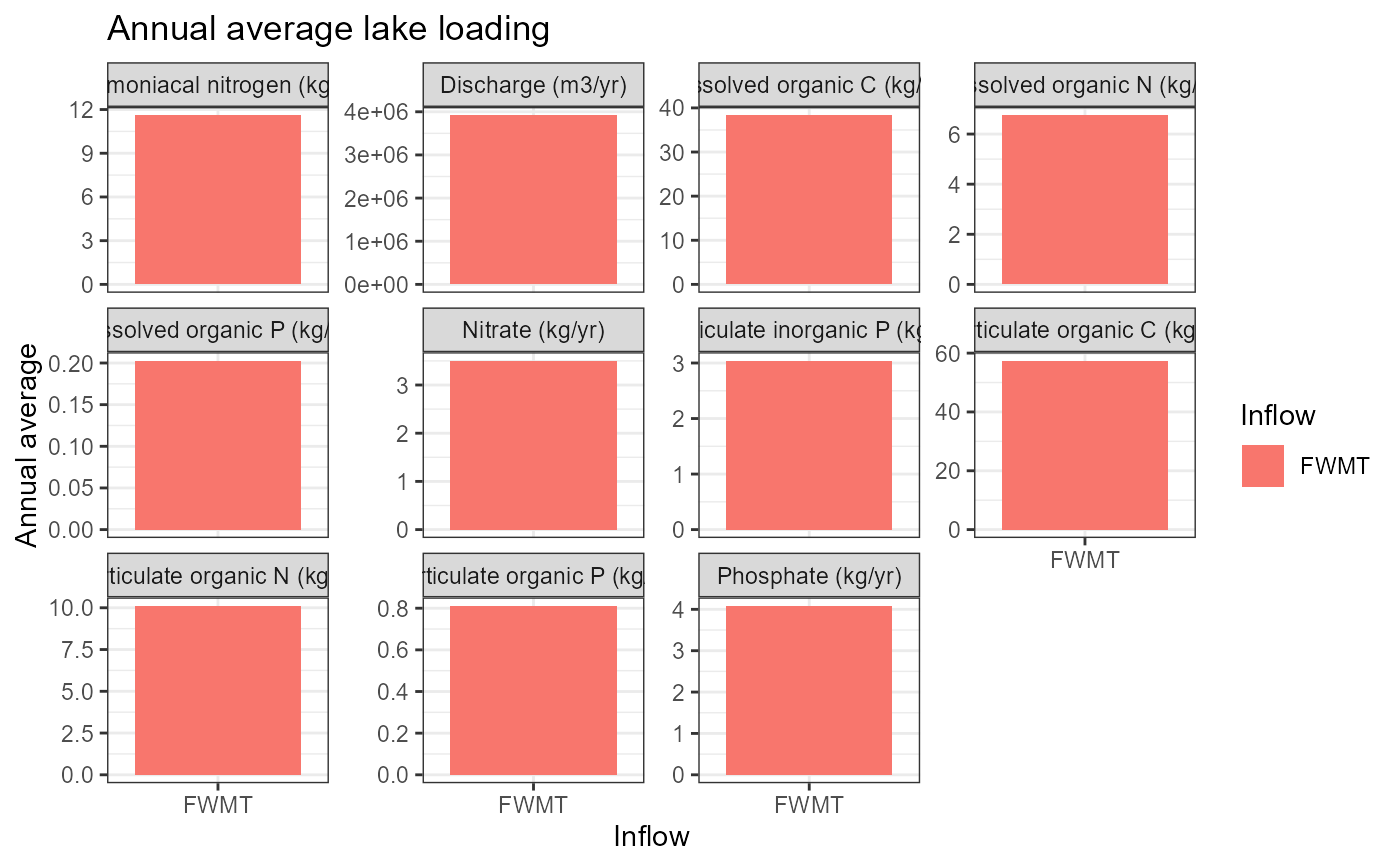
Visualises the output of summarise_loads() as bar charts of annual
average discharge and constituent loads, decomposed by inflow.
Arguments
- aeme
Aeme object.
- loads
data.frame; output of
summarise_loads(aeme, by_inflow = TRUE). IfNULL(default), it is calculated internally.- inflow_vars
character; vector of AEME inflow concentration variable names to plot (passed to
summarise_loads()whenloadsisNULL). IfNULL(default), all recognised mass-concentration variables present in the inflow data are plotted.
Value
A ggplot2 object with one facet per variable (discharge and each constituent load), showing the annual average contribution of each inflow.
Examples
aeme_file <- system.file("extdata/aeme.rds", package = "AEME")
aeme <- readRDS(aeme_file)
plot_loads(aeme)